Spotify concept project
ROLE
UX, UI, Research, Prototyping, Testing
duration
80+ hours, 2 weeks
YEAR
2020
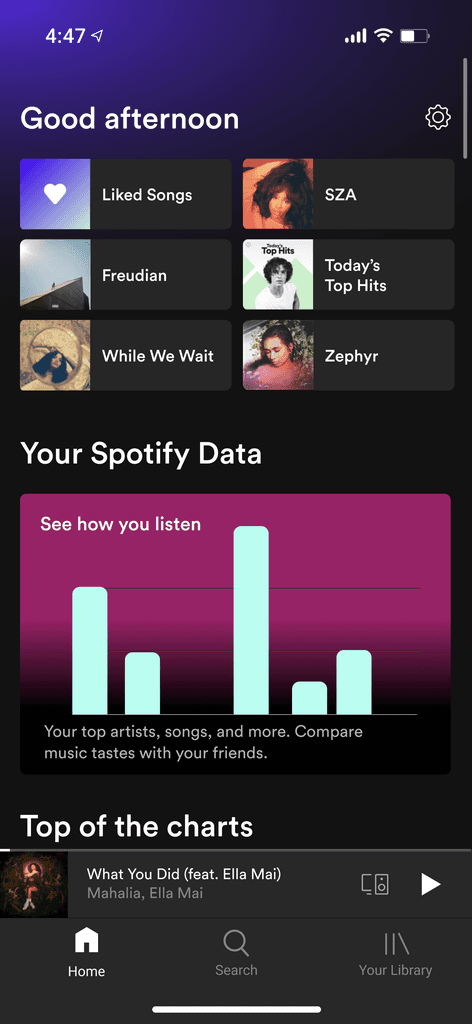
Spotify is considered to be a social media network, allowing users to see what their friends are listening to through the Activity Feed and sharing music through integrations like Facebook and Twitter. But should it stop there? Is there a more impactful way that users can connect with each other through music without having to leave the Spotify platform?
Market research
I started the project by looking into Spotify's user base and current features to get up to speed with the market and the platform itself. I analyzed its current features, where I discovered that Spotify Wrapped was the closest thing that Spotify had to a data feature.
In 2019, more than 60 million users engaged with this feature, sharing content 40 million times and streaming 6.5 billion songs from the playlist. I decided to study its patterns and practices and kept them in mind moving forward.
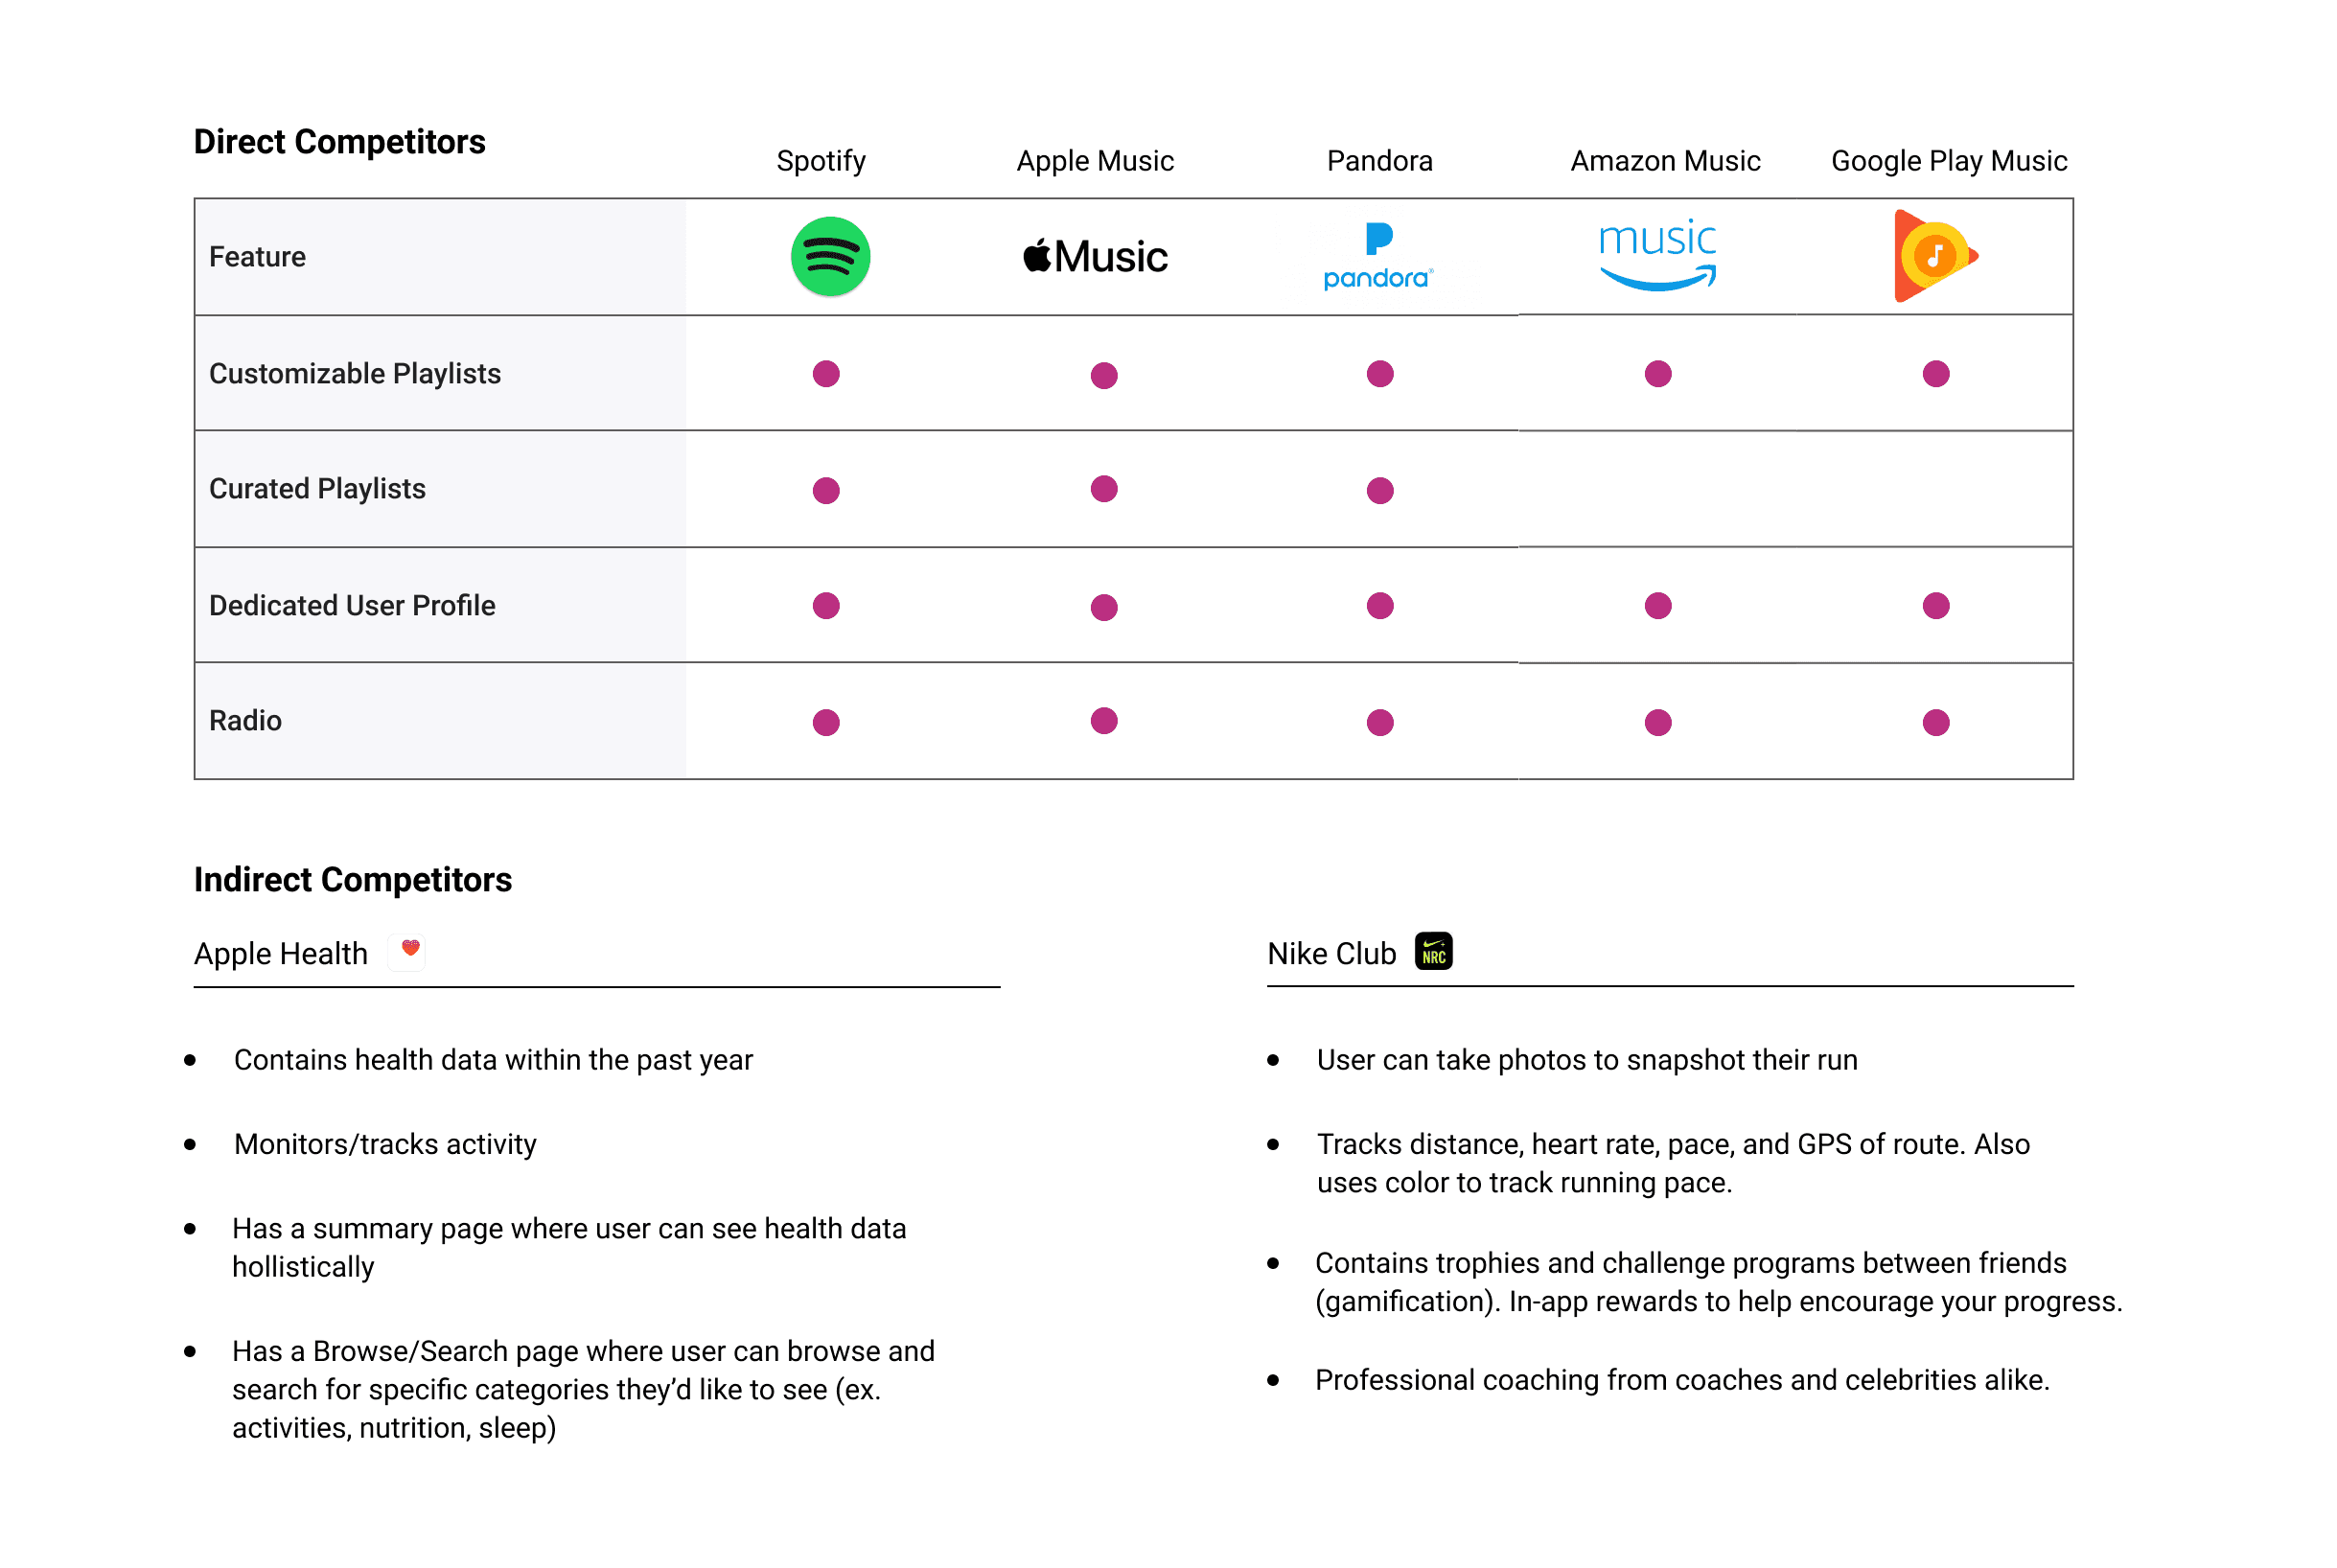
The competitors…
Spotify users would like to see their data if it was easy to digest and had the option to use it to connect with others.
I interviewed 7 participants who use Spotify regularly. The goal of interviews was to find out how users felt about viewing and sharing their data. To prepare for interviews, I drafted up a guide that included questions inquiring about their Spotify experiences, what kind of data they'd be interested in seeing on Spotify, and whether or not they'd like the app to be more social.
Control over data
Some users were private about their music taste, while others were open to sharing. This confirmed that users wanted control over their data.
Actionable data
In almost all interviews, users mentioned how much they enjoyed Spotify Wrapped at the end of the year because of its simplicity and ability to share results with others.
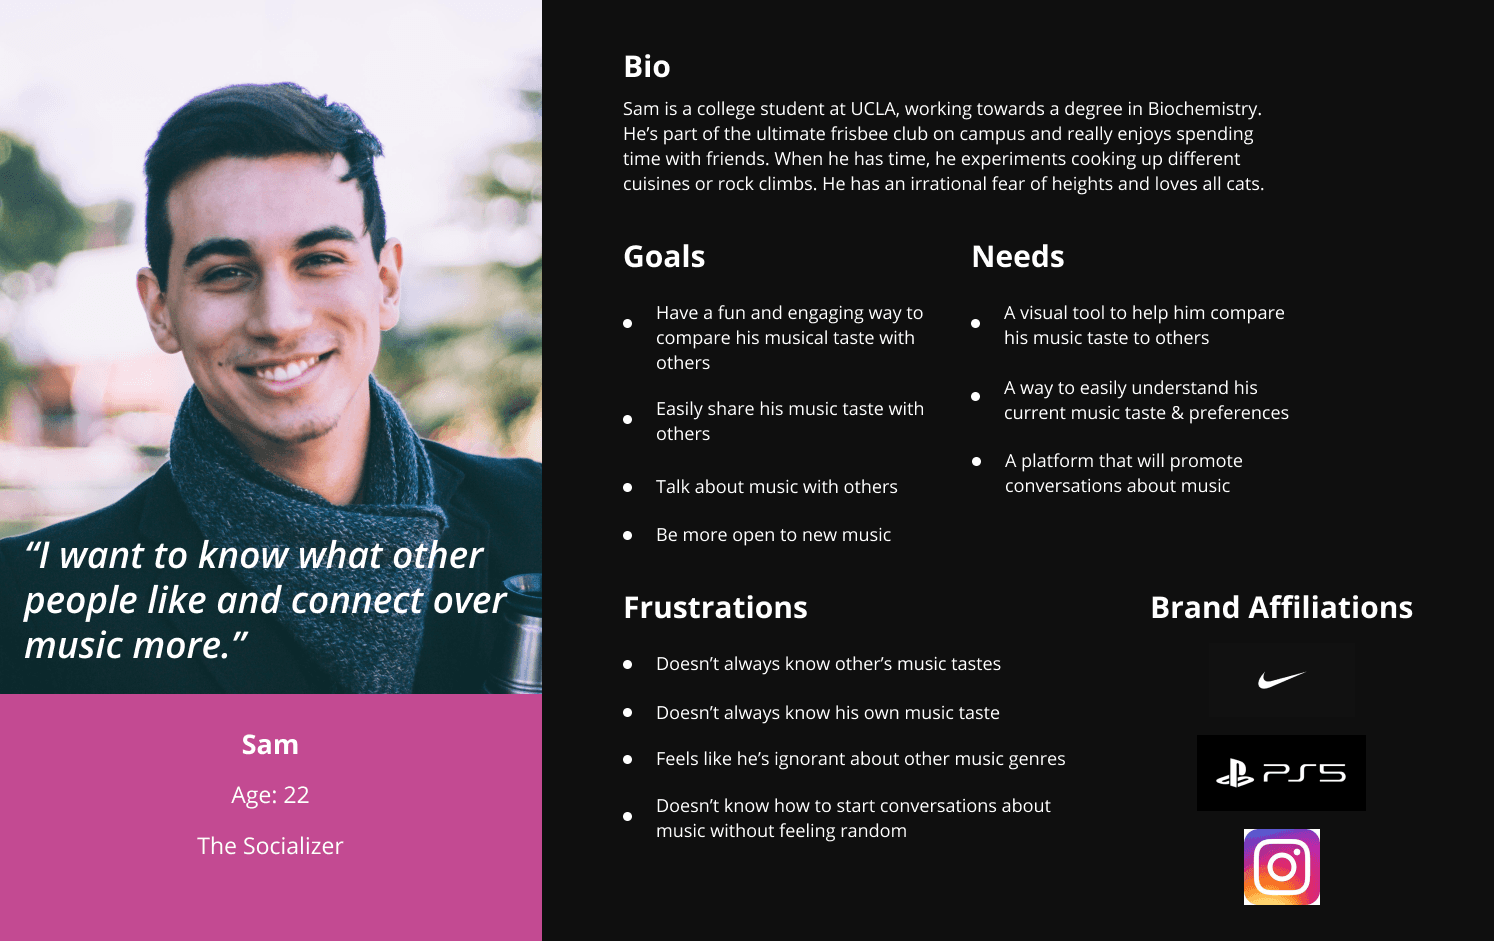
Taking my findings from research, I created 2 user personas that best represented the different type of users. This helped me focus in on who I was designing for and helped guide my design process.
Both target users ultimately have the same goal: to better understand their music taste and discover new music using those insights. The only difference lies in how they plan to use that data (either by sharing it with friends or staying private).
Meet Sam the Socializer & Patty the Private Listener
Sharing with friends
Sam is a social butterfly and enjoys sharing about himself, usually posting on social media. He's always open to learning and trying new things, and he finds that the best way to do that is through people.
staying private
Patty prefers to stay private. She likes to refer to her data for her own knowledge. She enjoys discovering things on her own, and if she were to share on social media, it would most likely only be with her close friends.
How might we help users visualize their music taste, discover new music, and make it easier to share music?
golden path
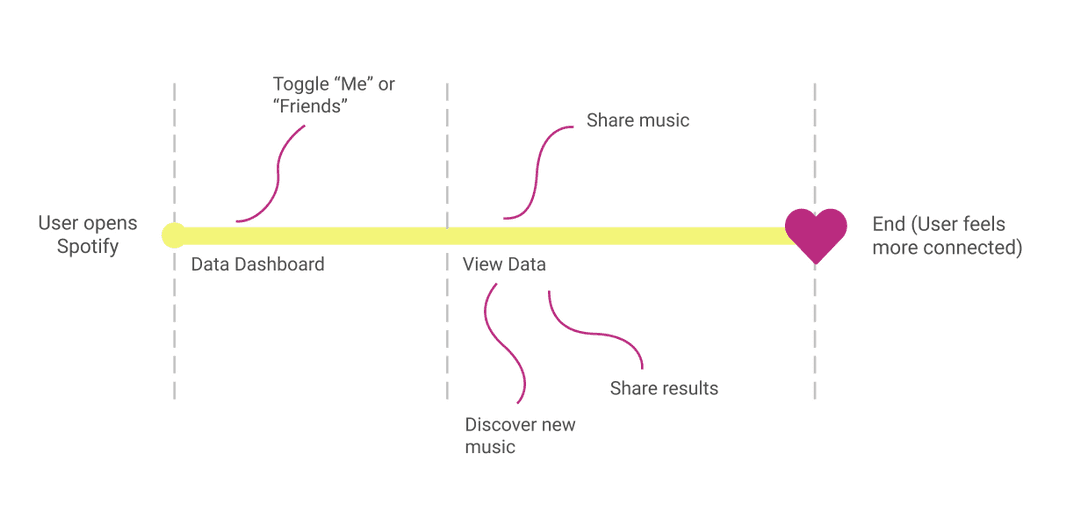
To start ideating on the information architecture, I created the Golden Path to represent the ideal path our users would want to experience. This helped in understanding the flow of the new feature as well as getting an idea of how many screens I would need to create.
Users would begin by opening up the Data Dashboard and viewing their data or their friend's data. From there, they would have the option to use that data to connect with other people or discover new music on their own. By the end, they would feel more connected to their friends or to themselves.
I created a journey map to help us visualize our user's experience using the new feature (their emotions, pain points, and motivations).
A huge insight taken from this was identifying the opportunity to include a way for users to send songs to friends without having to leave the app. Even from interviews, participants had mentioned wanting a faster and easier way to share songs with friends instead of having to post to other social media platforms or sending numerous links.
The design question I asked myself to guide my ideating and sketching was: How can I incorporate a data visualization feature into Spotify and somehow also make it a social tool?
I conducted live user testing over Zoom with 4 participants who were Spotify users. The goal was to test my assumptions of how users would navigate through the app, as well as find out what was working and what might be confusing to the user.
I had each user complete 3 tasks and asked that they share their thoughts out loud as they completed each one. I transcribed each user testing session and followed up each task with questions to gain a deeper understanding of any pains and frustrations they may have had.
See the 3 tasks below:
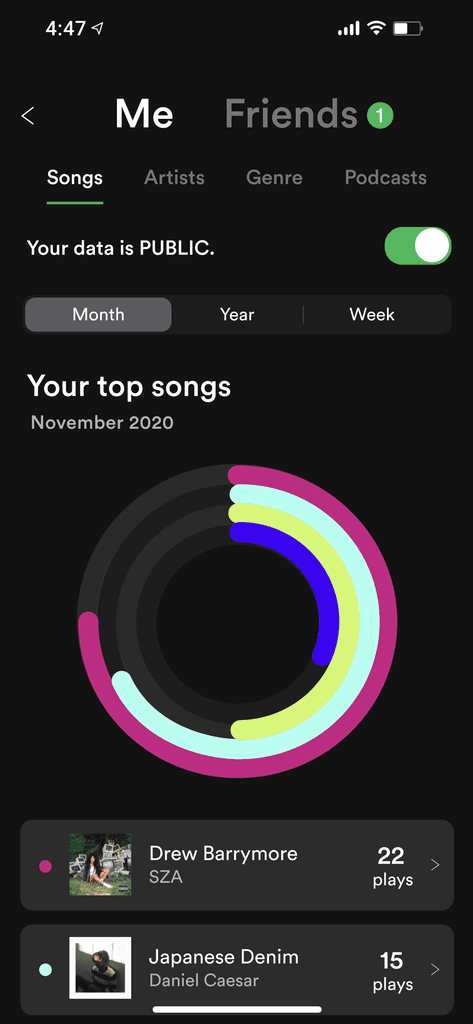
You’re interested in seeing the kind of music you’ve been listening to lately.
*Find out what your top song is for the month.
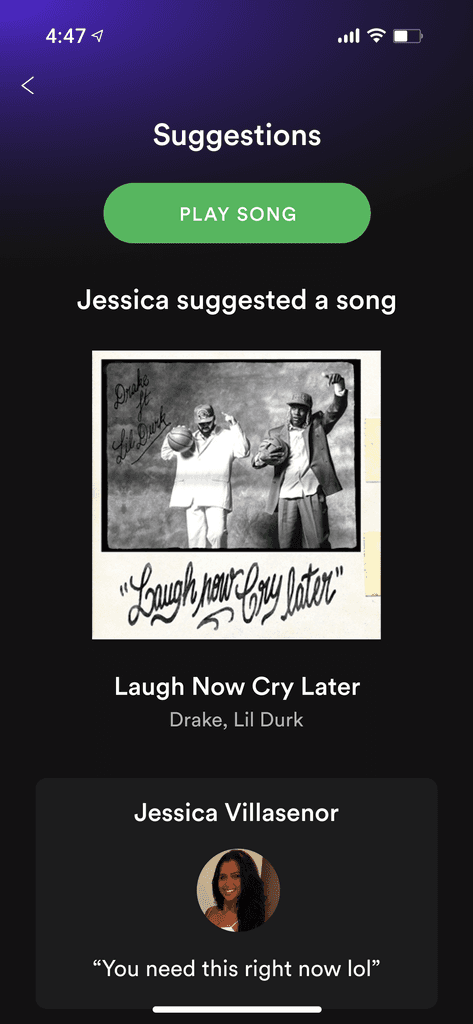
A notification pops up on your phone and you see that your friend has sent you a song suggestion on Spotify.
*Open and view the suggestion from Jessica.
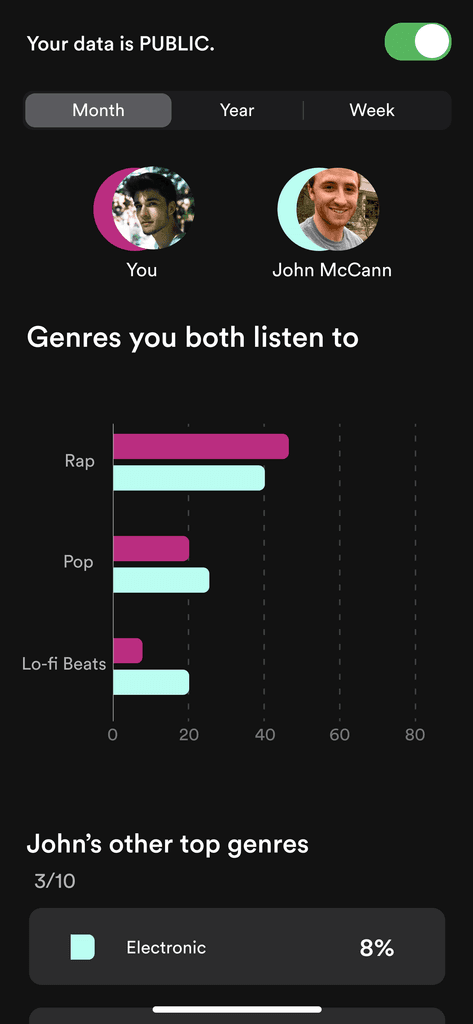
You feel like you’ve been listening to the same kind of music lately, and want to explore new music but don’t know where to look. You’re curious to see what kind of music some of your friends like.
*View and compare John’s Spotify data to yours.
Shown below is some of the positive feedback that I received from user testing:
"I would love to see this really be implemented in the app. It would be great."
"I think it's really cool. It's a lot of features in one. You get the social element but also the data to go with it!"
"Your adherence to their branding is spot on! The feature ie really well-integrated."
"You did a really great job - I love being able to compare your data with your friends and being able to send songs."
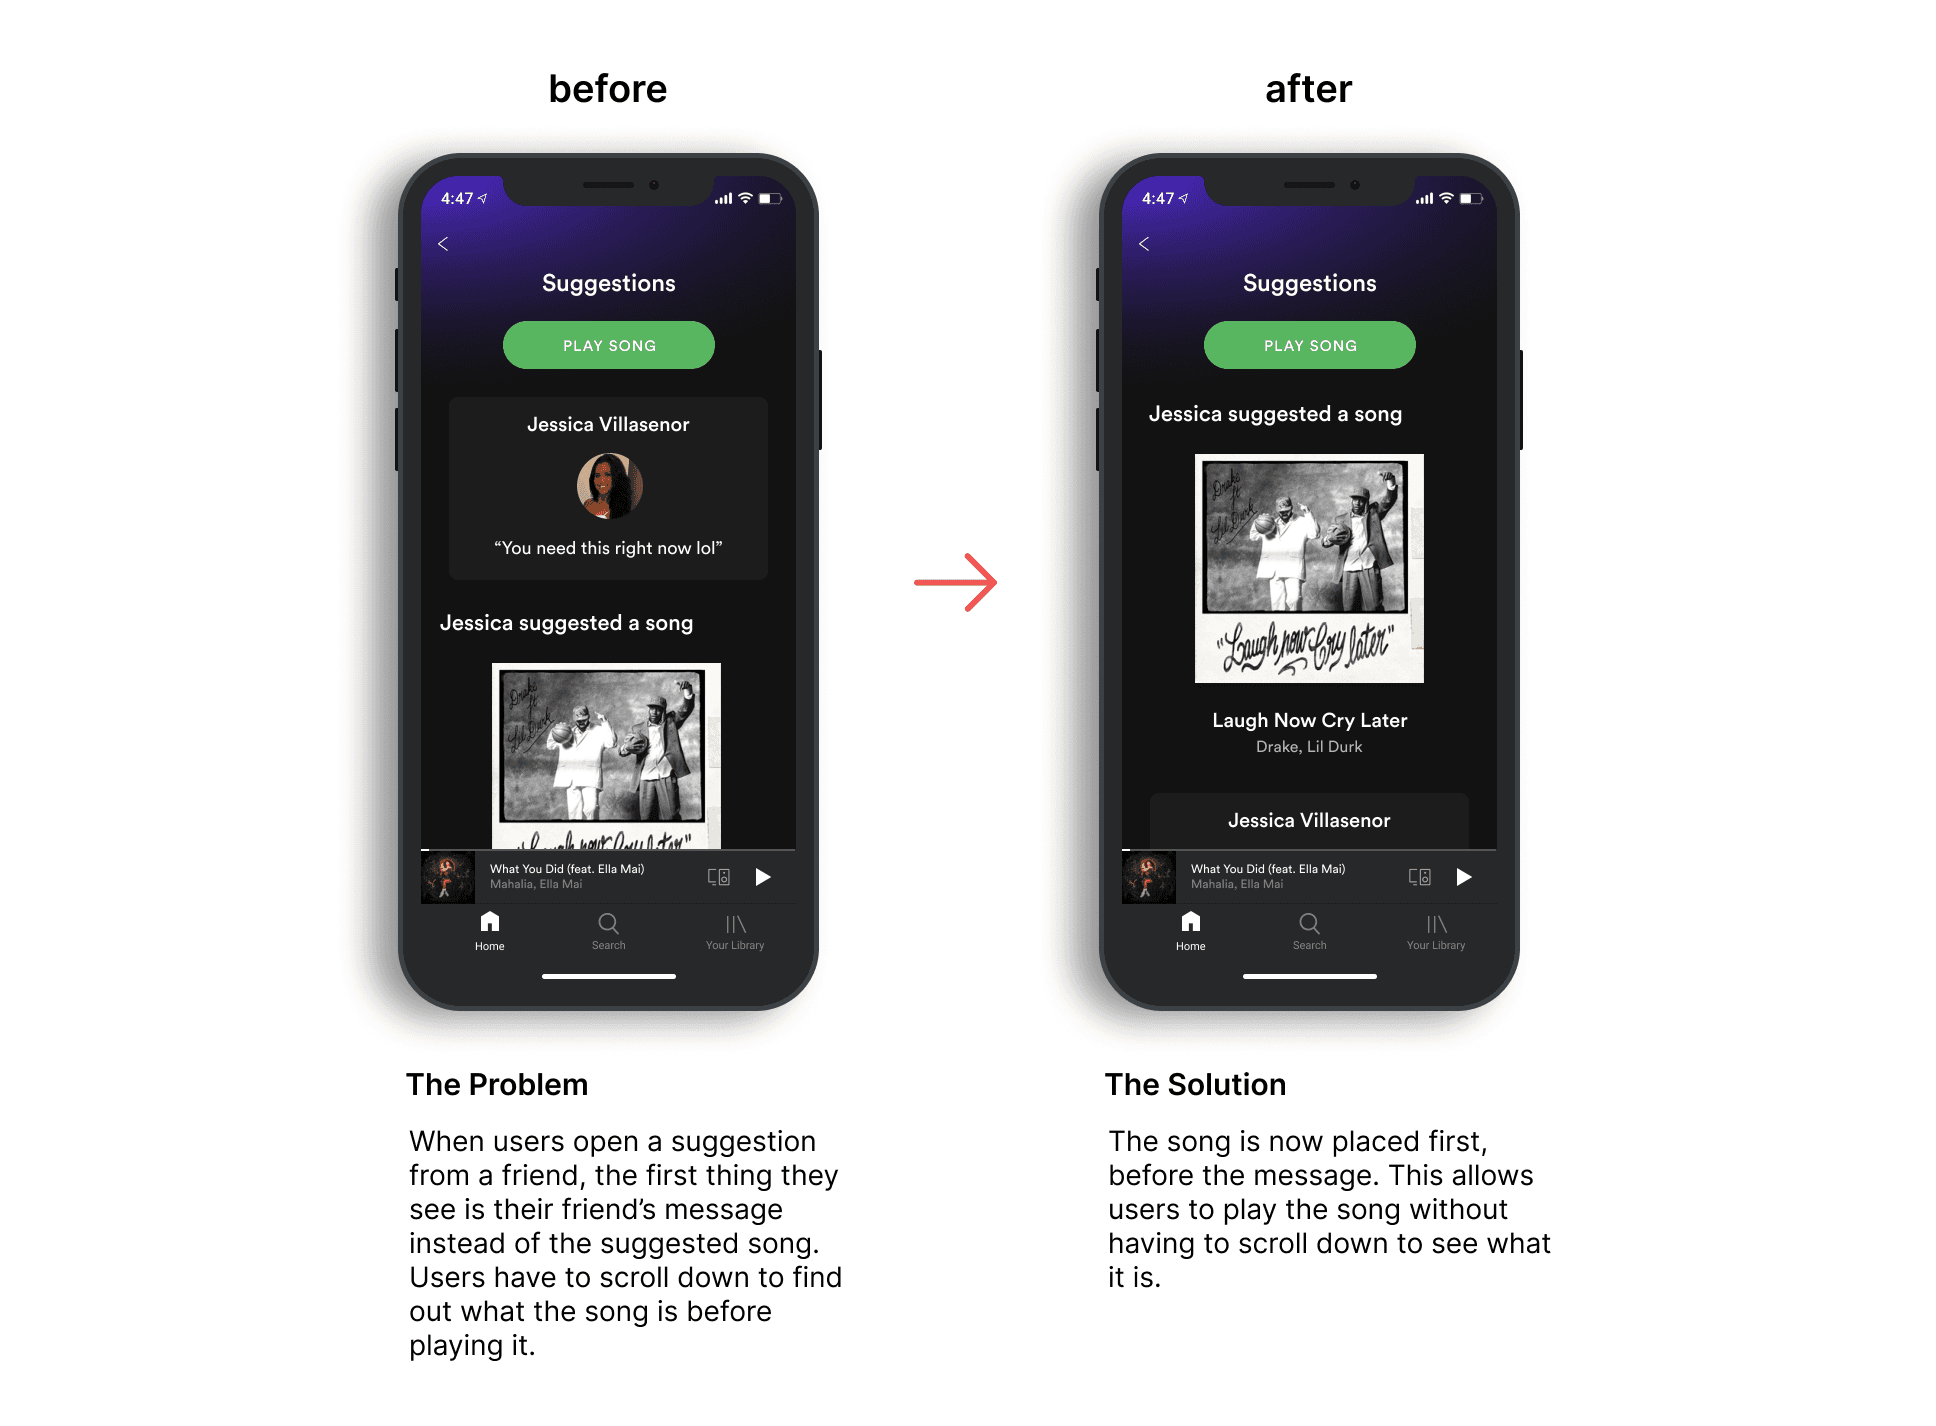
Most of the feedback given to improve the usability of my product was for minor changes. One of these minor changes includes the screen for when users open a suggestion from a friend. You can see the iteration below:
For future iterations, there are a few things that I would consider, given that I had more time and resources:
Conduct user testing with more people to get further feedback on my product.
Explore designing more of the screens (e.g., what the screens for users to view their top podcasts may look like).
Explore the data visualization world further to see what other ways data can be presented to users.
This project was a true challenge. Learning and working with data visualization while adhering to Spotify’s renowned design system was both exciting and daunting. However, the experience and knowledge gained from completing this project proved to be invaluable. I learned the complexity and scale of working with data, as well as the numerous factors a company must consider when adding even a single feature to their product.
